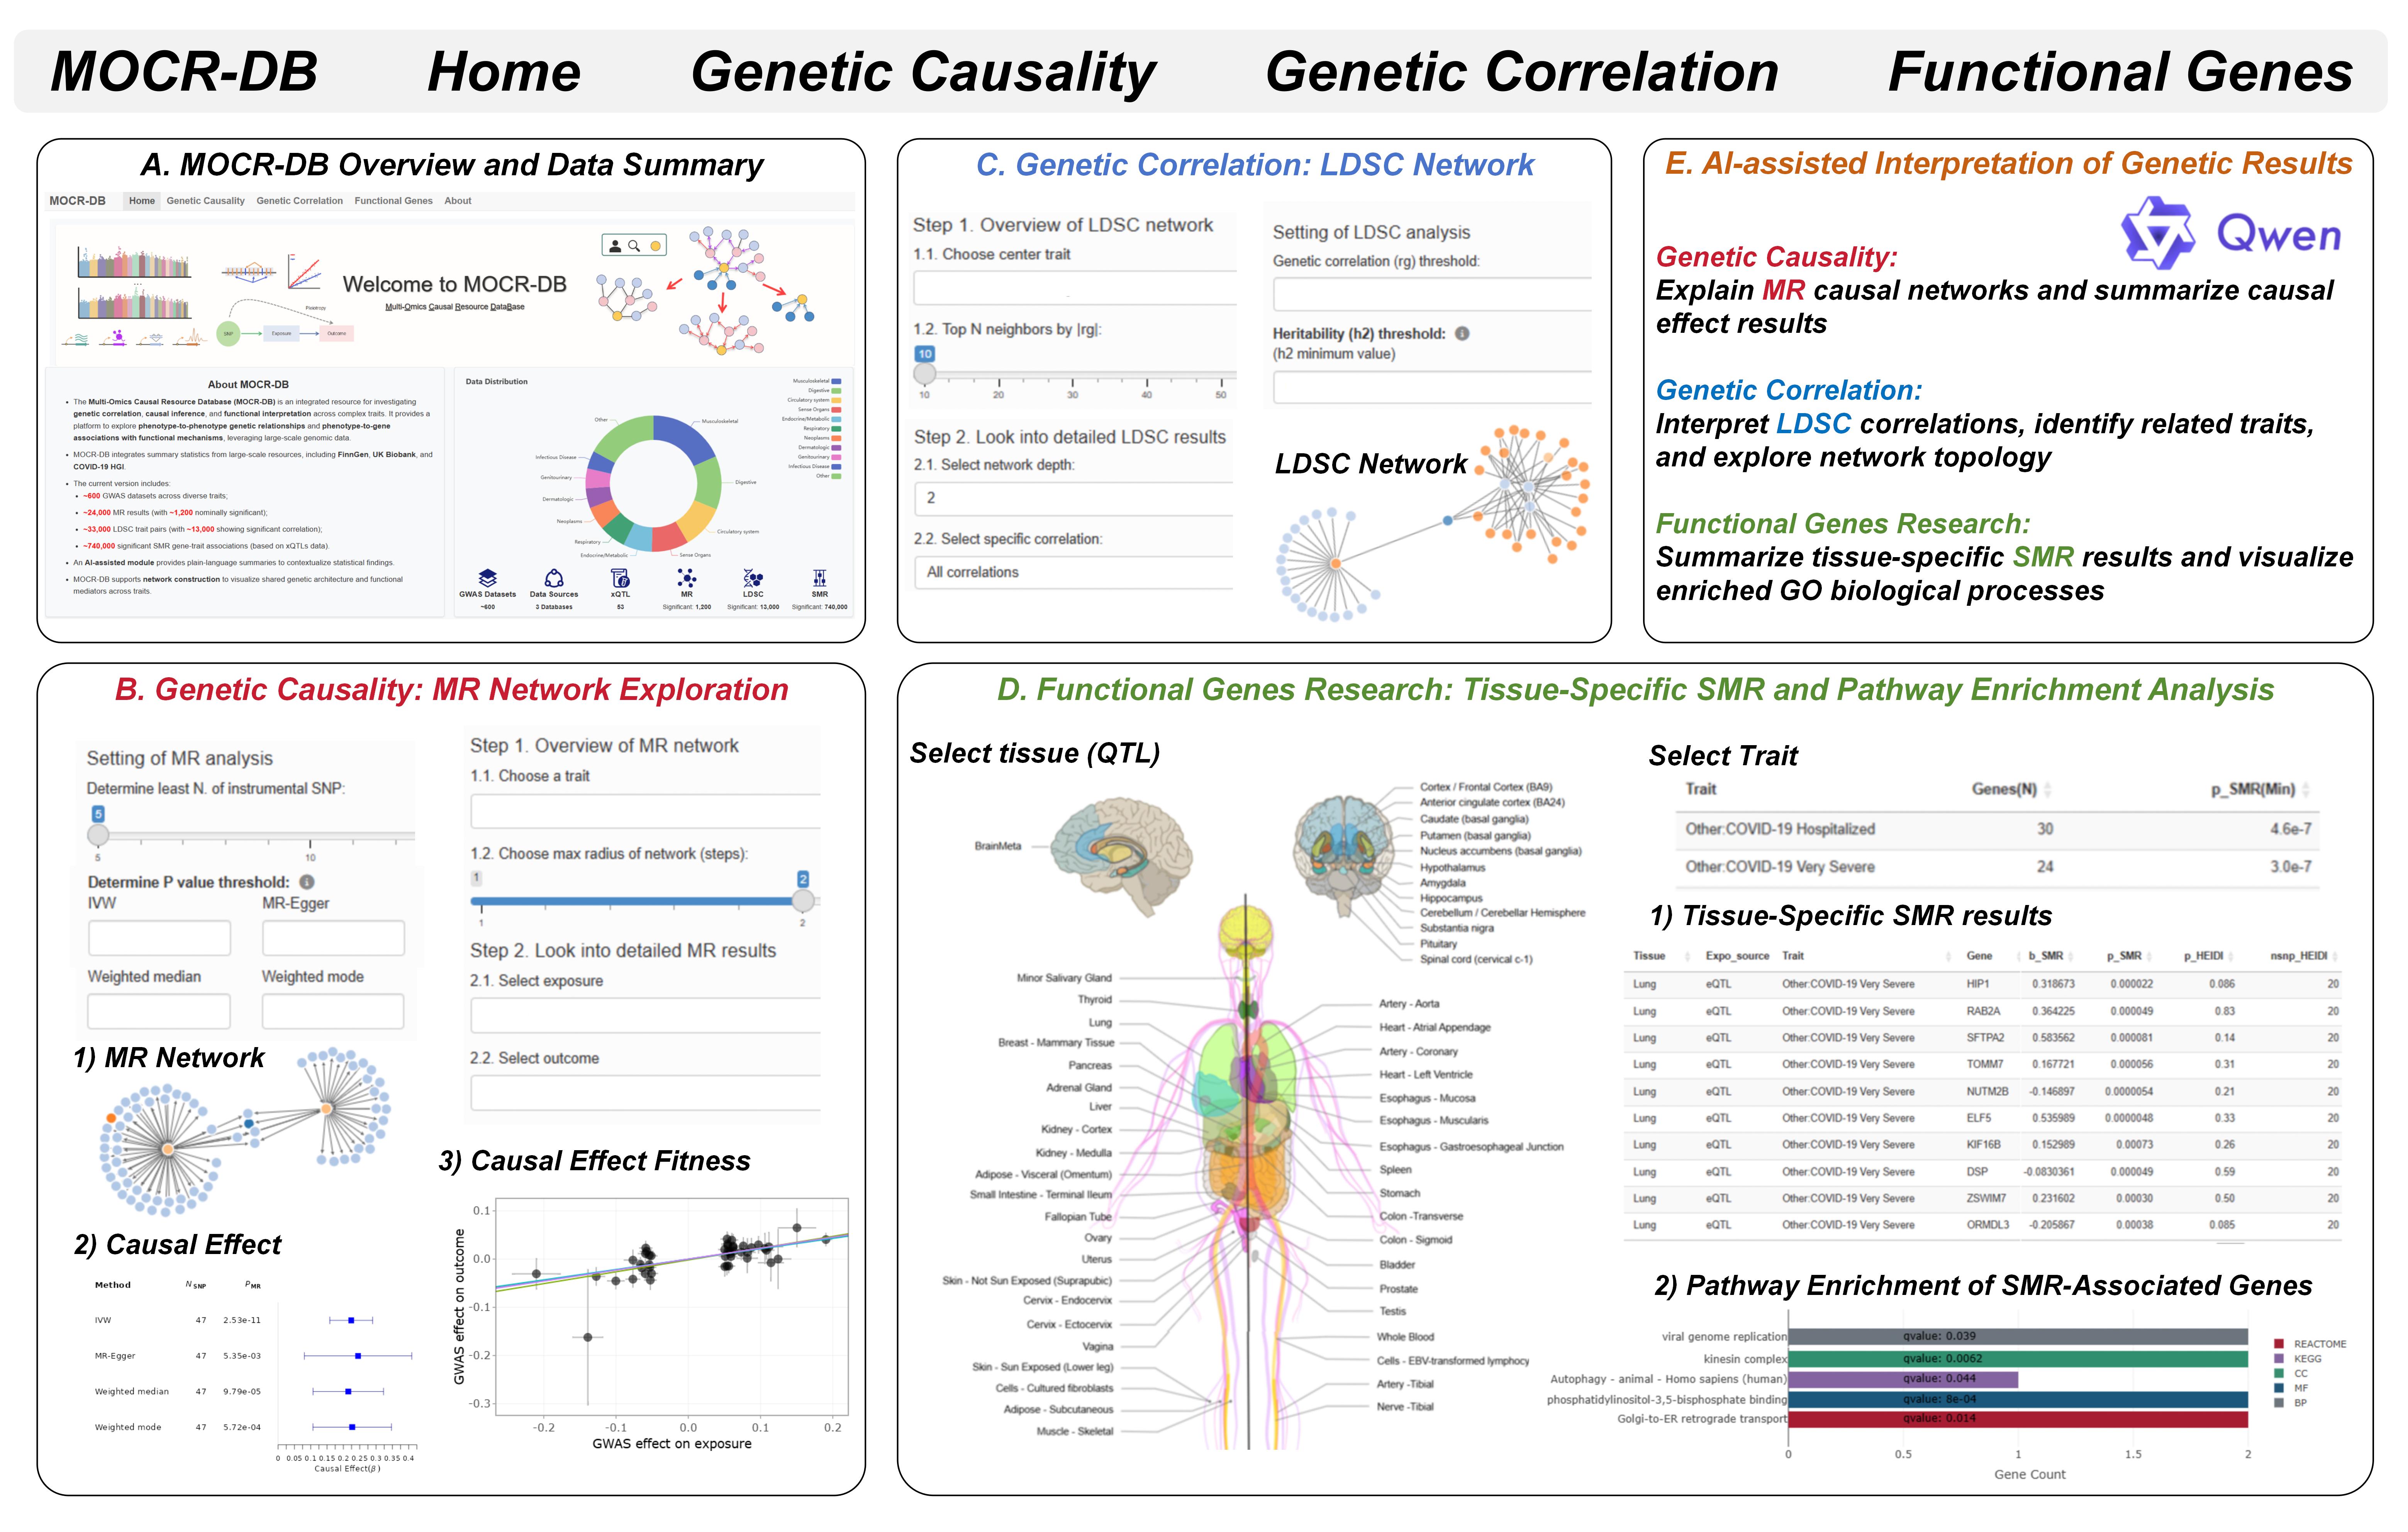

1.1. Choose center trait
FIN:Abrasion of teeth
FIN:Achilles tendinitis
FIN:Actinic keratosis
FIN:Acute alcohol intoxication
FIN:Acute and subacute iridocyclitis
FIN:Acute and transient psychotic disorders
FIN:Acute appendicitis
FIN:Acute appendicitis, no complications
FIN:Acute appendicitis, with complications
FIN:Acute bronchitis
FIN:Acute laryngitis and tracheitis
FIN:Acute pancreatitis
FIN:Acute pharyngitis
FIN:Acute renal failure
FIN:Acute sinusitis
FIN:Acute suppurative otitis media
FIN:Acute tubulo-interstitial nephritis
FIN:Acute upper respiratory infections
FIN:Acute upper respiratory infections of multiple and unspecified sites
FIN:Adhesive capsulitis of shoulder
FIN:Age-related macular degeneration (whether dry or wet)
FIN:Alcohol abuse, main dg (more control exclusions)
FIN:Alcohol dependence
FIN:All anxiety disorders
FIN:All influenza
FIN:All influenza (not pneumonia)
FIN:All pneumoniae
FIN:All-cause Heart Failure
FIN:Allergic asthma (mode)
FIN:Allergic conjunctivitis
FIN:Allergic contact dermatitis
FIN:Allergic rhinitis
FIN:Alzheimer’s disease (Atypical or mixed) (more control exclusions)
FIN:Alzheimer’s disease (Late onset) (more control exclusions)
FIN:Alzheimer’s disease, wide definition
FIN:Anaemias
FIN:Aneurysms, operations, SAH
FIN:Angina pectoris
FIN:Ankylosing spondylitis
FIN:Anomalies of dental arch relationship, including avohilmo
FIN:Anterior Iridocyclitis
FIN:Anxiety disorders (more control exclusions)
FIN:Any dementia (more control exclusions)
FIN:Any mental disorder
FIN:Aortic aneurysm
FIN:Appendectomy
FIN:Arthropathies
FIN:Artrosis, including avohilmo
FIN:Asthma (more control exclusions)
FIN:Asthma (only as main-diagnosis) (more control exclusions)
FIN:Asthma and allergy
FIN:Asthma-related acute respiratory infections
FIN:Asthma-related infections
FIN:Asthma-related pneumonia
FIN:Asthma, unspecified (mode)
FIN:Asthma/COPD (KELA code 203)
FIN:Atherosclerosis, excluding cerebral, coronary and PAD
FIN:Atopic dermatitis
FIN:Atrial fibrillation and flutter
FIN:Atrial fibrillation and flutter with reimbursement
FIN:Autoimmune diseases
FIN:Autoimmune diseases excluding thyroid diseases
FIN:Autoimmune diseases excluding thyroid diseases, strict definition
FIN:Autoimmune hyperthyroidism
FIN:AV-block
FIN:Bacterial infection, other or unspecified
FIN:Bacterial pneumoniae
FIN:Basal cell carcinoma (controls excluding all cancers)
FIN:Basal cell carcinoma, including avohilmo (controls excluding all cancers)
FIN:Behavioural and emotional disorders with onset usually occurring in childhood and adolescence
FIN:Bell's palsy
FIN:Benign lipomatous neoplasm
FIN:Benign lipomatous neoplasm of skin and subcutaneous tissue of trunk
FIN:Benign neoplasm of colon, rectum, anus and anal canal
FIN:Benign neoplasm of other and ill-defined parts of digestive system
FIN:Benign neoplasm: Colon
FIN:Benign neoplasm: Colon, unspecified
FIN:Benign neoplasm: Rectum
FIN:Benign neoplasm: Rectum, anus and anal canal
FIN:Benign neoplasm: Sigmoid colon
FIN:Benign paroxysmal vertigo
FIN:Bipolar affective disorders
FIN:Bleeding
FIN:Blepharochalasis
FIN:Bronchitis
FIN:Calcific aortic valvular stenosis, operated
FIN:Calculus of kidney and ureter
FIN:Cardiac arrest
FIN:Cardiac arrhythmias
FIN:Cardiomyopathy
FIN:Cardiomyopathy (excluding other)
FIN:Cardiovascular diseases (excluding rheumatic etc)
FIN:Carpal tunnel syndrome
FIN:Cellulitis
FIN:Cervical disc disorders
FIN:Cervicalgia
FIN:Cervicobrachial syndrome
FIN:Cervicocranial syndrome
FIN:Chalazion
FIN:Childhood allergy (age < 16)
FIN:Childhood asthma (age<16) (more control exclusions)
FIN:Cholecystectomy
FIN:Cholecystitis
FIN:Cholelithiasis
FIN:Chondropathies
FIN:Chronic diseases of tonsils and adenoids
FIN:Chronic gastritis
FIN:Chronic kidney disease
FIN:Chronic laryngitis and laryngotracheitis
FIN:Chronic lower respiratory diseases
FIN:Chronic pancreatitis
FIN:Chronic periapical parodontitis
FIN:Chronic periodontitis
FIN:Chronic rhinitis, nasopharyngitis and pharyngitis
FIN:Chronic sinusitis
FIN:Cirrhosis, broad definition used in the article https://doi.org/10.1101/594523
FIN:Coagulation defects, purpura and other haemorrhagic conditions
FIN:Coeliac disease
FIN:Colon adenocarcinoma (controls excluding all cancers)
FIN:Colonic or urogenital fistula
FIN:Colorectal adenocarcinoma (controls excluding all cancers)
FIN:Colorectal cancer (controls excluding all cancers)
FIN:Conduction disorders
FIN:Congenital iodine-deficiency syndrome/hypothyroidism
FIN:Congenital malformations of heart and great arteries
FIN:Conjunctivitis
FIN:Conjunctivitis (acute, non atopic)
FIN:Constipation
FIN:COPD
FIN:COPD/asthma/ILD related infections
FIN:Corneal ulcer
FIN:Coronary angioplasty
FIN:Coronary artery bypass grafting
FIN:Coronary atherosclerosis
FIN:Coronary revascularization (ANGIO or CABG)
FIN:Coxarthrosis
FIN:Coxarthrosis, primary
FIN:Coxarthrosis, primary, with hip surgery
FIN:Cutaneous abscess, furuncle and carbuncle
FIN:Cystitis
FIN:Death due to cardiac causes
FIN:Deforming dorsopathies
FIN:Degeneration of macula and posterior pole
FIN:Dementia
FIN:Dementia, including avohilmo
FIN:Dental pulpitis 1, only avohilmo
FIN:Dental pulpitis 3
FIN:Dentinal caries
FIN:Dentofacial anomalies [including malocclusion]
FIN:Depression
FIN:Depression or dysthymia
FIN:Dermatitis and eczema
FIN:Deviated nasal septum
FIN:Diabetic nephropathy (more control exclusions)
FIN:Diabetic neuropathy
FIN:Diabetic retinopathy (more control exclusions)
FIN:Diaphragmatic hernia
FIN:Diarrhoea and gastroenteritis of presumed infectious origin
FIN:Diplopia
FIN:Diseases of arteries, arterioles and capillaries (FINNGEN)
FIN:Diseases of external ear
FIN:Diseases of liver
FIN:Diseases of middle ear and mastoid
FIN:Diseases of oesophagus, stomach and duodenum
FIN:Diseases of oral cavity, salivary glands and jaws
FIN:Diseases of pulp and periapical tissues
FIN:Diseases of salivary glands
FIN:Diseases of veins, lymphatic vessels and lymph nodes, not elsewhere classified
FIN:Diseases of vocal cords and larynx+other diseases of upper respiratory tract, no elsewhere classified
FIN:Disorder of lipoprotein metabolism, unspecified
FIN:Disorders of choroid and retina
FIN:Disorders of eyelid, lacrimal system and orbit
FIN:Disorders of lacrimal system
FIN:Disorders of lipoprotein metabolism and other lipidaemias
FIN:Disorders of muscles
FIN:Disorders of ocular muscles, binocular movement, accommodation and refraction
FIN:Disorders of other endocrine glands
FIN:Disorders of parathyroid gland
FIN:Disorders of refraction and accommodation
FIN:Disorders of sclera, cornea, iris and ciliary body
FIN:Disorders of skin appendages
FIN:Disorders of synovium and tendon
FIN:Disorders of the thyroid gland
FIN:Disorders of vestibular function (Vertigo)
FIN:Disorders of vitreous body
FIN:Diverticular disease of intestine
FIN:Dorsalgia
FIN:Dorsopathies
FIN:Dry age-related macular degeneration (includes geographic atrophy)
FIN:Duodenal ulcer
FIN:DVT of lower extremities
FIN:Early lumbar disc prolapse, operated
FIN:Early onset COPD
FIN:Embedded and impacted teeth
FIN:Emotionally unstable personality disorder
FIN:Enthesopathies of lower limb, excluding foot
FIN:Epilepsy
FIN:Erosion of teeth, including avohilmo
FIN:Erysipelas
FIN:Excessive attrition of teeth
FIN:Falls/tendency to fall
FIN:Familial hypercholesterolemia
FIN:Fibroblastic disorders
FIN:Flat foot [pes planus] (acquired)
FIN:Focal epilepsy
FIN:Focal epilepsy, mode (most common among epilepsy diagnosis)
FIN:Focal epilepsy, strict definition
FIN:Follicular cysts of skin and subcutaneous tissue
FIN:Fracture at wrist and hand level
FIN:Fracture of femur
FIN:Fracture of foot, except ankle
FIN:Fracture of forearm
FIN:Fracture of lower leg, including ankle
FIN:Fracture of lumbar spine and pelvis
FIN:Fracture of rib(s), sternum and thoracic spine
FIN:Fracture of shoulder and upper arm
FIN:Fracture of skull and facial bones
FIN:Functional dyspepsia
FIN:Ganglion
FIN:Gastric ulcer
FIN:Gastro-oesophageal reflux disease
FIN:Gastroduodenal ulcer
FIN:Generalized anxiety disorder
FIN:Gingivitis and periodontal diseases
FIN:Glaucoma
FIN:Glaucoma suspect
FIN:Glomerular diseases
FIN:Gonarthrosis
FIN:Gonarthrosis, primary, with knee surgery
FIN:Gout
FIN:Gout, strict definition
FIN:Gout, unspecified
FIN:Haemorrhoids and perianal venous thrombosis
FIN:Hallux rigidus
FIN:Hallux valgus (acquired)
FIN:Hard cardiovascular diseases
FIN:Heart failure and bmi 25plus
FIN:Heart failure and coronary heart disease
FIN:Heart failure, strict
FIN:Heart failure, strict (more control exclusions)
FIN:Hernia
FIN:Hernia of abdominal wall
FIN:Hernia of abdominal wall, postoperative
FIN:Hydrocele
FIN:Hyperkinetic disorders (more control exclusions)
FIN:Hyperlipidaemia, other/unspecified
FIN:Hyperparathyroidism
FIN:Hypertension
FIN:Hypertension, essential
FIN:Hypertensive Heart Disease
FIN:Hypertrophy of breast in women and men
FIN:Hypo-osmolality and hyponatraemia
FIN:Hypokalaemia
FIN:Hypotension
FIN:Hypothyroidism, strict autoimmune
FIN:Impacted teeth
FIN:Impingement syndrome of shoulder
FIN:Impotence
FIN:Infections of the skin and subcutaneous tissue
FIN:Infections with a predominantly sexual mode of transmission
FIN:Infective dermatitis
FIN:Inflammatory bowel disease, strict (require KELA)
FIN:Influenza and pneumonia
FIN:Inguinal hernia
FIN:Insomnia
FIN:Internal derangement of knee
FIN:Interstitial lung disease endpoints
FIN:Intestinal infectious diseases
FIN:Intracerebral haemorrhage
FIN:Iridocyclitis
FIN:Iron deficiency anaemia
FIN:Iron deficiency anaemia secondary to blood loss (chronic)
FIN:Irritable bowel syndrome
FIN:Ischaemic heart disease, wide definition
FIN:Kela-code for severe mental illness
FIN:Keratitis
FIN:Later onset COPD
FIN:Lateral epicondylitis
FIN:Lesion of ulnar nerve
FIN:Lichen ruber planus, wide definition including periferal and oral lichen planus
FIN:Low back pain
FIN:Lower back pain or/and sciatica
FIN:Major coronary heart disease event
FIN:Malignant melanoma (controls excluding all cancers)
FIN:Malignant melanoma of skin (controls excluding all cancers)
FIN:Malignant neoplasm (controls excluding all cancers)
FIN:Malignant neoplasm of bronchus and lung (controls excluding all cancers)
FIN:Malignant neoplasm of colon (controls excluding all cancers)
FIN:Malignant neoplasm of skin (controls excluding all cancers)
FIN:Malignant neoplasm of thyroid gland (controls excluding all cancers)
FIN:Melanocytic naevi
FIN:Meniscus derangement
FIN:Metabolic disorders
FIN:Metatarsalgia
FIN:Migraine
FIN:Migraine with aura
FIN:Migraine without aura
FIN:Mixed conductive and sensorineural hearing loss
FIN:Mood [affective] disorders
FIN:Mucosal proctocolitis
FIN:Myalgia
FIN:Mycoses
FIN:Myocardial infarction, strict
FIN:Myopia
FIN:Nasal polyp
FIN:Nerve, nerve root and plexus disorders
FIN:Non-allergic asthma (mode) (more control exclusions)
FIN:Non-ischemic cardiomyopathy
FIN:Non-rheumatic valve diseases
FIN:Non-small cell lung cancer (controls excluding all cancers)
FIN:Noninfective enteritis and colitis
FIN:Nonsuppurative otitis media
FIN:Nontoxic goitre/thyroid nodule
FIN:Nontoxic multinodular goitre
FIN:Nontraumatic intracranial haemmorrhage
FIN:Obesity
FIN:Obesity due to excess calories
FIN:Obesity related asthma
FIN:Obesity, other/unspecified
FIN:Osteoporosis
FIN:Other (seronegative) rheumatoid arthritis, wide
FIN:Other acute lower respiratory infections
FIN:Other and unspecified anaemias
FIN:Other and unspecified dermatitis
FIN:Other and unspecified disorders of vitreous body
FIN:Other and unspecified iron deficiency
FIN:Other and unspecified nonorganic psychotic disorders
FIN:Other and unspecified polyneuropathies, also in other diseases
FIN:Other and unspecified tonsillitis
FIN:Other and unspecified urticaria
FIN:Other anxiety disorders
FIN:Other arrhythmias
FIN:Other arthritis (FG)
FIN:Other arthrosis
FIN:Other bacterial diseases
FIN:Other benign neoplasms of skin
FIN:Other bursopathies
FIN:Other cataract
FIN:Other degenerative diseases of the nervous system
FIN:Other diseases of anus and rectum
FIN:Other diseases of intestines
FIN:Other diseases of lip and oral mucosa
FIN:Other diseases of liver
FIN:Other diseases of pleura
FIN:Other diseases of the digestive system
FIN:Other diseases of the respiratory system
FIN:Other diseases of upper respiratory tract
FIN:Other diseases of urinary system
FIN:Other disorders of bone
FIN:Other disorders of ear
FIN:Other disorders of eyelid
FIN:Other disorders of fluid, electrolyte and acid-base balance
FIN:Other disorders of patella
FIN:Other disorders of skin and subcutaneous tissue
FIN:Other disorders of skin and subcutaneous tissue, not elsewhere classified
FIN:Other disorders of the musculoskeletal system and connective tissue
FIN:Other disorders of urethra and urinary system
FIN:Other disorders of veins
FIN:Other dorsopathies, not elsewhere classified
FIN:Other embolism and thrombosis
FIN:Other enthesopathies
FIN:Other functional intestinal disorders
FIN:Other gastritis (incl. Duodenitis)
FIN:Other hammer toe(s) (acquired)
FIN:Other headache syndromes
FIN:Other hearing loss
FIN:Other heart diseases
FIN:Other intervertebral disc disorders
FIN:Other joint disorders
FIN:Other malignant neoplasms of skin (=non-melanoma skin cancer) (controls excluding all cancers)
FIN:Other menopausal disorders
FIN:Other neurological diseases
FIN:Other noninfective gastroenteritis and colitis
FIN:Other obstructive and reflux uropathy
FIN:Other or unspecified ileus, impaction or obstruction
FIN:Other reaction to severe stress, and adjustment disorders
FIN:Other retinal disorders
FIN:Other septicaemia
FIN:Other shoulder lesions
FIN:Other sleep disorders
FIN:Other strabismus
FIN:Other systemic involvement of connective tissue (FG)
FIN:Other viral diseases
FIN:Other/unspecified dorsalgia
FIN:Other/unspecified rheumatoid arthritis
FIN:Other/unspecified seropositive rheumatoid arthritis
FIN:Otitis externa
FIN:Otitis media, unspecified
FIN:Pain (limb, back, neck, head abdominally)
FIN:Pain in joint
FIN:Pain in limb
FIN:Pain in thoracic spine
FIN:Palmar fascial fibromatosis [Dupuytren]
FIN:Panic disorder
FIN:Papillary adenocarcinoma of thyroid gland (controls excluding all cancers)
FIN:Papulosquamous disorders
FIN:Paralytic ileus and intestinal obstruction
FIN:Parkinson's disease
FIN:Parodontitis or operation codes
FIN:Parodontitis or/and operation codes
FIN:Paroxysmal tachycardia
FIN:Peritonsillar abscess
FIN:Persistent mood disorders
FIN:Phlebitis and thrombophlebitis (not including DVT)
FIN:Phobic anxiety disorders
FIN:Plantar fascial fibromatosis
FIN:Pleural effusion
FIN:Pollen allergy
FIN:Polyarthropathies
FIN:Polyarthrosis
FIN:Presbycusis
FIN:Primary coxarthrosis, bilateral
FIN:Primary gonarthrosis, bilateral
FIN:Primary open-angle glaucoma, strict
FIN:Primary_lymphoid and hematopoietic malignant neoplasms (controls excluding all cancers)
FIN:Procreative management
FIN:Psoriasis
FIN:Psoriasis vulgaris
FIN:Psoriatic arthropathies
FIN:Pulmonary embolism
FIN:Pure hypercholesterolaemia
FIN:Purpura and other haemorrhagic conditions
FIN:Radiculopathy
FIN:Recurrent or chronic depression
FIN:Renal failure
FIN:Renal tubulo-interstitial diseases
FIN:Retention of urine
FIN:Retinal breaks without detachment
FIN:Retinal detachment with retinal break
FIN:Retinal detachments and breaks
FIN:Rheumatism, unspecified
FIN:Rheumatoid arthritis
FIN:Rotator cuff syndrome
FIN:Sarcoidosis
FIN:Schizophrenia
FIN:Schizophrenia or delusion (more control exclusions)
FIN:Sciatica+with lumbago
FIN:Seborrhoeic keratosis
FIN:Secondary hypertension
FIN:Senile cataract
FIN:Sensorineural hearing loss
FIN:Sequelae of cerebrovascular disease
FIN:Seronegative rheumatoid arthritis
FIN:Seropositive rheumatoid arthritis, strict definition
FIN:Seropositive rheumatoid arthritis, wide
FIN:severe traumatic brain injury, does not include concussion
FIN:Shoulder lesions
FIN:Sleep apnoea
FIN:Sleep apnoea, including avohilmo
FIN:Sleep disorders (combined)
FIN:Smoking
FIN:Soft tissue disorders
FIN:Somatoform disorder
FIN:Spinal stenosis
FIN:Spondyloarthritis
FIN:Spondylolisthesis/Spondylolysis
FIN:Spondylopathies
FIN:Spondylopathies (FG)
FIN:Spondylosis
FIN:Squamous cell neoplasms and carcinomas of the skin (controls excluding all cancers)
FIN:Stomatitis and related lesions
FIN:STROKE
FIN:Stroke, excluding SAH
FIN:Subjective visual disturbances
FIN:Suicide or other Intentional self-harm
FIN:Suppurative and unspecified otitis media
FIN:Systemic connective tissue disorders
FIN:Temporomandibular joint disorders
FIN:Temporomandibular joint disorders, including avohilmo
FIN:Thoracic aortic aneurysm
FIN:Thyroiditis
FIN:Thyrotoxicosis
FIN:Thyrotoxicosis with diffuse goitre
FIN:Tinnitus
FIN:Tonsillectomy and adenotomy
FIN:Transient ischemic attack
FIN:Trigger finger
FIN:Trochanteric bursitis
FIN:Type 2 diabetes, definitions combined
FIN:Type 2 diabetes, wide definition
FIN:Type1 diabetes, definitions combined
FIN:Ulcer of lower limb, not elsewhere classified
FIN:Ulcerative colitis (strict definition, require KELA, min 2 HDR)
FIN:Ulcerative colitis, NAS
FIN:Umbilical hernia
FIN:Unspecified acute lower respiratory infection
FIN:Unstable angina pectoris
FIN:Urticaria
FIN:Valvular heart disease excluding rheumatic fever
FIN:Varicose veins
FIN:Venous thromboembolism
FIN:Ventral hernia
FIN:Viral and other specified intestinal infections
FIN:Visual disturbances
FIN:Vocal cord dysfunction
FIN:Wet age-related macular degeneration
Other:COVID-19 Hospitalized
Other:COVID-19 Very Severe
UKB:Abdominal pain
UKB:Anal and rectal conditions
UKB:Anal and rectal polyp
UKB:Angina pectoris
UKB:Arthropathy NOS
UKB:Atrial fibrillation and flutter
UKB:Back pain
UKB:Benign neoplasm of colon
UKB:Benign neoplasm of skin
UKB:Cancer code, self-reported: prostate cancer
UKB:Cancer code, self-reported: thyroid cancer
UKB:Cataract
UKB:Cellulitis and abscess of arm/hand
UKB:Cellulitis and abscess of foot, toe
UKB:Cellulitis and abscess of leg, except foot
UKB:Cholelithiasis
UKB:Cholelithiasis with other cholecystitis
UKB:Coronary atherosclerosis
UKB:Diaphragmatic hernia
UKB:Diseases of hair and hair follicles
UKB:Diverticulosis
UKB:Enthesopathy
UKB:Esophagitis, GERD and related diseases
UKB:Fracture of radius and ulna
UKB:Gastritis and duodenitis
UKB:GERD
UKB:Hallux valgus (Bunion)
UKB:Hematuria
UKB:Hemorrhage of rectum and anus
UKB:Hemorrhoids
UKB:Inguinal hernia
UKB:Internal derangement of knee
UKB:Iron deficiency anemias, unspecified or not due to blood loss
UKB:Lipoma of skin and subcutaneous tissue
UKB:Myocardial infarction
UKB:Noninfectious gastroenteritis
UKB:Nonspecific chest pain
UKB:Osteoarthritis; localized
UKB:Osteoarthrosis, localized, primary
UKB:Other diseases of respiratory system, NEC
UKB:Other headache syndromes
UKB:Other non-epithelial cancer of skin
UKB:Other specified gastritis
UKB:Pain in joint
UKB:Pain in limb
UKB:Peripheral enthesopathies and allied syndromes
UKB:Reflux esophagitis
UKB:Sebaceous cyst
UKB:Senile cataract
UKB:Symptoms involving digestive system
UKB:Syncope and collapse
UKB:Unspecified monoarthritis
UKB:Urinary incontinence
UKB:Urinary tract infection
UKB:Varicose veins of lower extremity